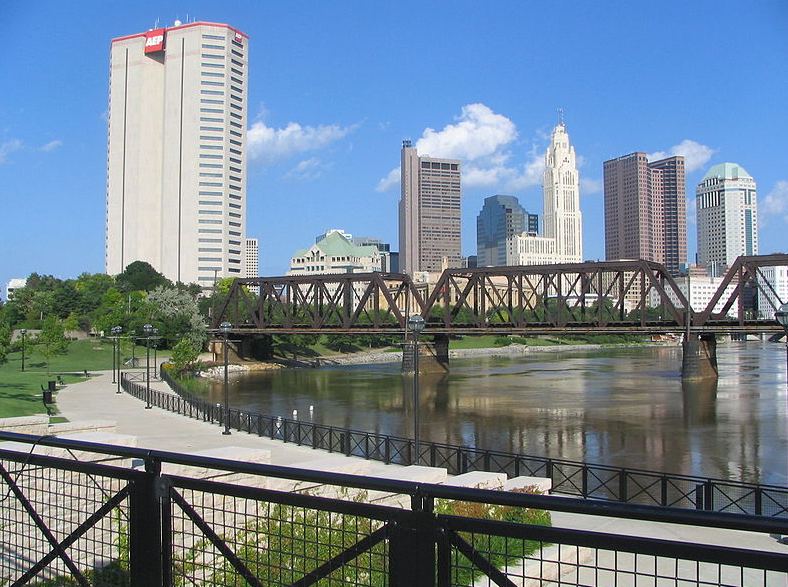
Columbus Will Become Biggest City in State

Pack it all in guys, things are going to cramped in the next decade. Yes, Columbus is looking to add 251,587 residents — finally throwing our weight around as the fastest growing metropolitan area in Ohio — this will put us 30,000 more residents over our neighbor to the south, and current largest city, Cincinnati.
We’re expected to experience 12.4% growth in the next ten years, whereas Cincinnati only grows 4.1%.
Whether this is good news or not, is certainly up for debate but Columbus is growing, like it or not — and we’re growing very fast.
What about Ohio’s other cities? A majority of them aren’t growing. Infact, according to the study, only 9 major Ohio cities will grow in the next ten years, the rest get smaller.
Some of the biggest ones shrinking are:
Akron with a -0.2% change
Dayton with a -0.8% change
Toledo with a -2.0% change (losing 12k residents)
And the biggest losers around are:
Youngstown with a -6.3% change (losing 34k residents)
Cleveland — Losing 49k Residents / -2.4% Change
This data comes from ACBJ’s Population Projections, “Each area’s population and national rank are shown for the initial and final years of the given span, along with the area’s raw and percent changes in population. The data for 2015 come from the U.S. Census Bureau. The projections for subsequent years were produced by ACBJ. (Click here to learn how we generated our projections.)” They wrote on the site, detailing how their data works.
BROUGHT TO YOU BY


